Introduction to Graph Machine Learning
Very basic introduction to different terminologies and overview in Graph ML.
This is an introductory blog post, where we will cover all the basics terminologies, to get started with GraphML. Later parts will cover details regarding each of the Graph Machine learning topics and hands-on experiences with Graph Neural networks in PyTorch Geometric or dgl.
#more
Why Graph ML is nowadays so popular?
The traditional machine learning techniques, like simple linear regression, naive Bayes, decision trees, random forests, SVMs, SVRs which are nothing but a blend of statistical Inferences and computational algorithms, seemed to be very appropriate for data with very fewer complexities. But with the rising complexity of the data, w.r.t structural changes and increasing dimensionality, which can be seen in images, texts, wave-forms, graphs, etc, these kinds of algorithms started to give less promising and generalized results and facing classic problems like the curse of dimensionality, easy underfitting or overfitting of the models.
So, when traditional machine learning algorithms seemed to get failed with the increasing complexity of data, that time a new subset of Machine learning called deep learning emerged out. And all deep learning algorithms from the oldest to the latest one, revolve around the foundations of the working mechanisms of Neural Networks. Based on the working Neural Networks, two more fundamental architectures, CNN for images and RNN for sequential data emerged out, and were very successful in learning and generalizing universal approximation functions for complex data like images and sequential data like texts, waveforms, etc.
But here comes the twist. Till now, all the methods and types of data (images, text, etc) were falling under the category of structured data. These all types of data, like tabular data, images, texts, etc are all some kind of euclidian data. And this euclidian origin makes their learning/optimization easy and stable. But what about the Graphical data. Graphical data are so much ubiquitous, that they can be seen everywhere. Some of the examples are:
-
- The internet itself
-
- The facebook network of friends
-
- Molecular structures
-
- Our Brain (combination of millions of neurons)
-
- 3D shapes, etc.
Even the images and texts or the waveforms can be seen and translated as graphical data. But those types of graphical data are kind of trivial. As those are structured, unlike general graphical data. So predicting something which is based on non-euclidean subspace is difficult for traditional deep learning or machine learning models. Because we all know that graphs do not have any certain length or shape. And how we should represent the edges. How to represent the connections. Now here anyone comes with the answer that we can use adjacency matrices. But then think of the scale of the data, we are talking about. Suppose, we have to compute giant graphs, like facebook's network of users and their friends. So for all these uncertainties, we can not use simple MLP or MLP based models to figure out optimized solutions. And so for this, a new subset of Machine Learning comes into play, which is known as Graph Machine Learning.
So, what are Graphs?
A graph is nothing but a collection of different nodes, which are connected with some links called edges. Mathematically we can define a graph as :
$$ G = (V, E, A) $$
Where G represents a graph, and V represents a collection of nodes: { v1, v2 …. vn} and E represents collections of edges: {e1, e2, ….. em} and A represent the topological structure by defining the adjacency matrix.
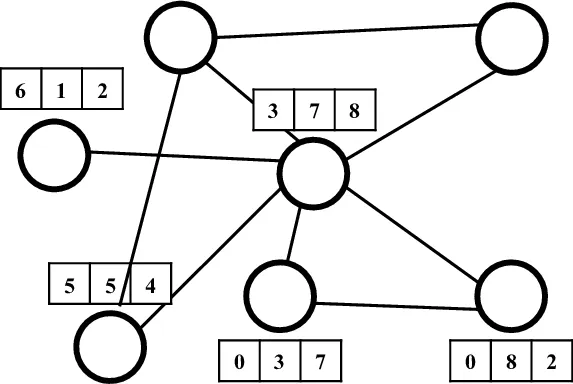
So this is how we generally represent a graph structure. Now we might have read in some courses like data structures, that graphs are one of the essential data structures for path-finding algorithms. This is true. But if we see, then we generally deal with nodes, which are often represented as some numbers like 1,2,3 ... or some letters like A, B, C, ... But in Machine learning, the nodes we see, do not contain some single numbers or letters. We represent each of the nodes and sometimes the edges as vectors. And so, these nodes containing some vectors within them are known to be node features. If edges are also represented as some vectors, then we define that as edge features.
Now, sometimes people get confused, by considering edge features representing the connections of the graphs. This is a wrong assumption. Edge features are some kind of optional features, we use in graph ML other than node features, which helps us to learn the underlined representation more undoubtedly. But these edge features are not the representatives of the connection within the nodes. Connections are represented as the Adjacency matrix. For example, we can think of a chemical molecule as a graph. The nodes represent the atoms, and the edges represent the different types of bonds, like a single bond, double bond, etc. So for representing the types of bond, we require some features, that are represented through edge features. Edge features are not important as node features every time. Also, we will discuss more details in the later parts.
Node features
 (Source: Research Gate)
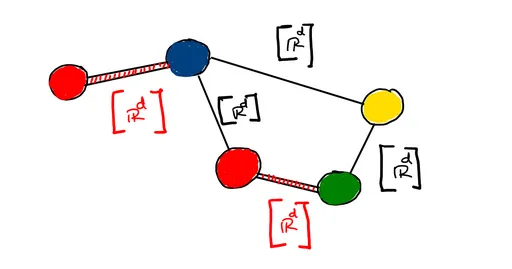
Node features are the fundamental input for graph machine learning models. This is simply the feature vector a node of a graph is carrying. Mathematically a graph G = (V, E) where V is the set of nodes. All the nodes v that belongs to V are a d-dimensional vector. Those d-dimensional vectors are the node feature vectors. So if there are N Nodes and every node is having d-dimensional features, the input matrix X is a N x d matrix. Some simple examples might include, suppose in a molecular graph, the nodes are the atoms, and each atom may have several properties like:
- atomic number
- mass num, atomicity
- hybridization of the atom
All these are some numerical value features, and when stacked together turns out to be a vector.
Edge Features
Edge features are similar to node features, but Edge features do not represent the connection in between the nodes of the graphs As mentioned in the earlier example, we already know that atoms can be considered some sort of small graphs, and these atoms have different types of bonds, which can be considered as edges of the graphs. So different kinds of properties like:
- Type of the bond (single, double, triple)
- Bond angle
- any other sort of chemical properties of the bonds, which have some sort of numerical/boolean values
All of these when stacked upon each other form a vector of supposed m dimension. This vector formed is known as edge features of the graphs. In most of the scenarios, edge features are generally been ignored, as they are sometimes less significant than node features or not available.
Adjacency matrix and Adjacency lists
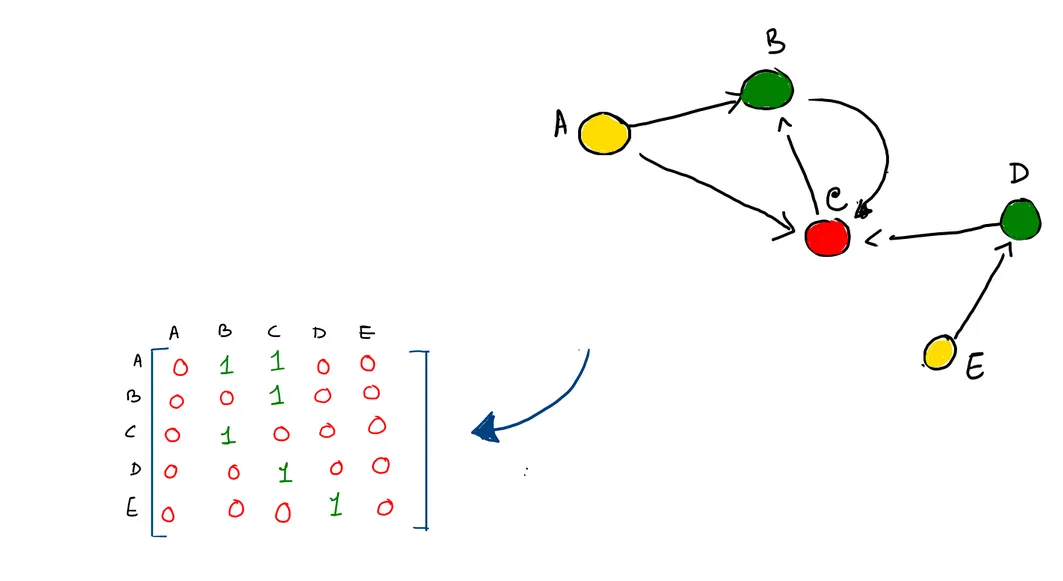
The adjacency matrix is the one way in which we store the connections between the graphs. An element will be 1, if there exists some kind of connection between the nodes else it will be 0. But here is a problem. Consider a giant graph, which is as big as a Facebook social network. In this case, most of the entries are zeros, making the graph a highly sparse matrix. Algorithms based on that would be highly in-efficient based on space. An alternative to the adjacency matrix is the adjacency list or coordinate format. There are different ways to represent an adjacency list. For e.g taking a group of tuples, where each tuple represents the node's source and target node connection.
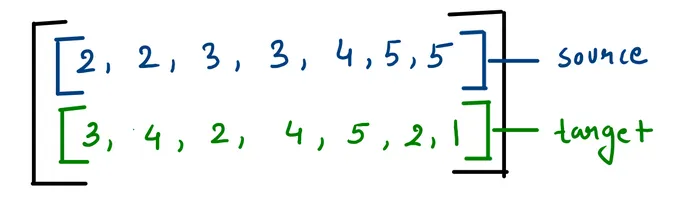
We can take two lists or a 2d matrix of 2 rows and m-columns, where m is the total number of valid connections, where the first row is the source and the other is the target. The figure shows the connections in the COO format of the same graph.
Embeddings
This is one of the most important concepts which is not only important in GraphML but also in general. We generally hear this word from the NLP field the most. But we know that embedding is everywhere.
Defining an embedding is easy, it's simply we initially get a high dimensional input data (such as a word from corpora), and we make a method such that it is translated into low dimensional representations. And this representation learns the schematics of the given input, such that we get to the observer that similar kinds of input are similar to each other.
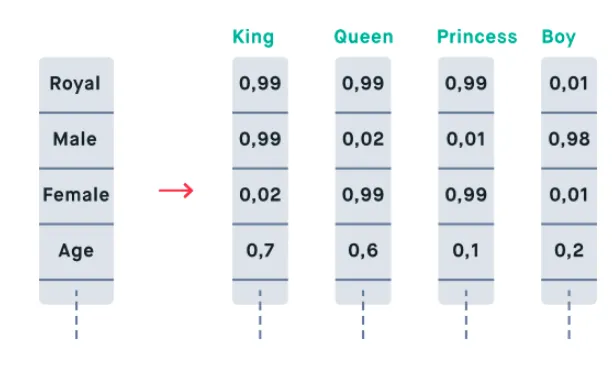
For example, if we get three words {“king”, “queen”, “hello”}. Here king and queen have quite a similar kind of embeddings as both represent persons, elite classes, something based on history, etc. Whereas the word Hello is a greetings, which does not share the similar kind of schematics.
So What are embeddings in Graphs?
 (Source: Research Gate)
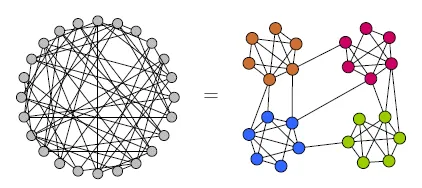
Now if we know what embeddings are, then it's easy to know what embeddings in graphs would mean. Suppose we are given a graph, and let us consider, we have node and/or edge features. Initially, we have some kind of values of these features, and we can not find any kind of relations of different nodes by just examining those features. So we do some kind of operations on graphs, such that we transform those input features into some kind of representations, and those representations group the similar kind of nodes together. If you see in this figure (right), then we will see that initially the nodes of the graph are distributed in a random order. We apply some function f such that it captures some kind of schematics from the neighbors. After some time, we can see that nodes with similar kinds of representations stay together with lesser distances, whereas nodes with relatively less similar representations tend to stay far from each other spatially. The example picture below to the first one shows an example of the before and after learning the representation of real-world knowledge graphs.
Graph Embeddings
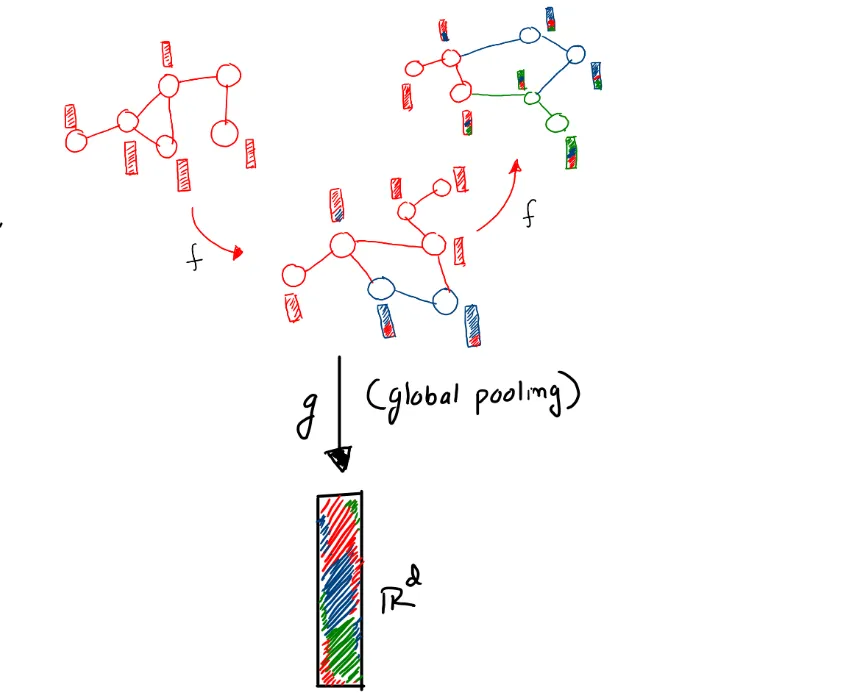
These are some kind of unified representation, that represents the whole graphs. Now, we can not acquire the features of graphs directly from the graphs. We indirectly get that from the node and/or the edge features. For sake of simplicity, suppose our graphs have only node features. Now we process these node features, by passing them into some black box, called GNN layers. And we get some more refined representation of the nodes.
Now those embeddings are also nothing but a matrix (stacked vectors of different node embeddings). And we do some kind of an operation, such that we convert this (N x D) (where N = the number of nodes, D = number of features of each node), into an N-dimensional vector, such that each element of the vector represents a collective feature of each node. Altogether forming a representation of the graph. The operation done generally, in this case, is called global graph pooling. More will be covered in later blogs.
## Looking into the cycle of a GraphML problem. So now we know all the basics and components of a graph and its essential needs for machine learning. So if we see a typical Graph machine learning scenario, then it can be divided into some steps:
-
- Getting the raw data
-
- Formulating the problem as a graph problem
-
- Converting the raw data into graph data, which is a combination of nodes and meaningful edges.
-
- Using GraphMl methods to get some kind of meaningful representation of the nodes and/or edges and graph if required
-
- Doing the required level of tasks
-
- Finally the trained model is deployed into the corresponding cloud services.
Application of GraphML
There are innumerable applications of Graph Machine Learning. Some of them are as follows:
-
- Drug discovery.
-
- Mesh generation (2D, 3D)
-
- Molecule property detection
-
- Social circle detection
-
- Categorization of users/items
-
- Protein folding problems
-
- New-gen Recommender system
-
- Knowledge graph completions
-
- Traffic forecast
-
- Social media connections recommendations for new users.
And this list goes on. We will discuss these tasks in more detail about their workings and other factors in the upcoming blogs.
Conclusion
So in this blog, we all have learned why these fields have emerged and grown so fast. We also learned the basics of graphs, and different properties and technical terms frequently used in Graph ML. In the next session, we will learn about different kinds of tasks of Graph ML, and different types of graphs used in Graph ML. Also in later blogs, we will deep dive into the inner working of Graph ML algorithms and make the models in PyTorch geometric or in DGL (Deep Graph Library). So stay tuned.
FREE VS Code / PyCharm Extensions I Use
✅ Write cleaner code with Sourcery, instant refactoring suggestions: Link*
Python Problem-Solving Bootcamp
🚀 Solve 42 programming puzzles over the course of 21 days: Link*