Learn about Pandas groupby operations - From Zero to Hero
Master the Pandas groupby operations in multiple steps with examples from easy to advanced ones.
Master the Pandas groupby operations in multiple steps with examples from easy to advanced ones.
Overview:
- What is aggregation?
- Dataset review and understanding
- Code steps
- Step 1: Apply a
groupbyoperation with a mean function - Step 2: Multiple aggregate functions in a single groupby
- Step 3: Group by multiple columns
- Step 4: Sorting group results (Multiple column case)
- Step 5: Use
groupbywith filtering:
#more
What is aggregation?
One of the important tools in data science is to know how to aggregate data. Aggregation techniques enable the programmer (or the data scientist) to understand more about the data she or he's working on.
But what is aggregation exactly? Aggregation is to group the data observations into distinct groups (or categories) and then we can apply some statistical functions on those groups like mean, median, standard deviation, sum, product, count, minimum, maximum, and many other cool functions.
After reading this post, we'll be able to work with any kind of dataset and apply complex groupby operations.
In this post we will work on the pokemon data. You don't have to worry! we will explain each detail of this data before moving to the code.
To download the dataset, click this link. It is a link from GitHub that contains the raw data of the pokemon dataset. We can notice that the format of data is similar to the format of a csv file.
We can read the dataset directly from the provided GitHub link. Here is our starting block of code:
import pandas as pd

path='https://gist.githubusercontent.com/armgilles/194bcff35001e7eb53a2a8b441e8b2c6/raw/92200bc0a673d5ce2110aaad4544ed6c4010f687/pokemon.csv'
pokemon_data = pd.read_csv(path, index_col = '#')
Dataset review and understanding
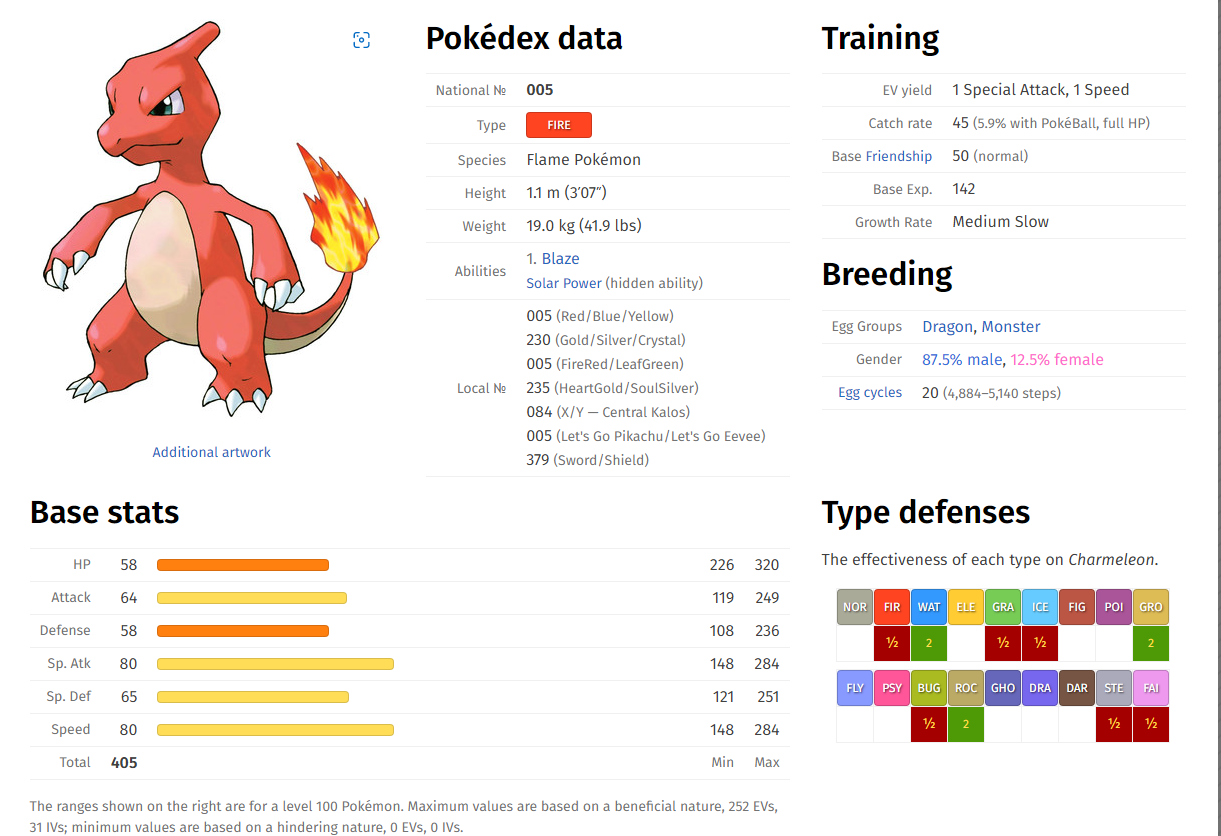
Pokemon is an anime which the main character always wants to collect pokemon monsters and we need to help him to know more about those pokemons.
So, our data is definitely about pokemon monsters, each observation of pokemon data represents a pokemon(a certain monster).
Every pokemon has a set of attributes like Attack, Defense, HP, and Monster Type.
Our dataset contains a set of 11 columns (excluding the name of the pokemon):
Type 1: the type of a pokemon, the pokemon can have type like Grass, Fire or any other attribute.Type 2: the same as the first attribute, but with different types.Total: the total sum of the following numerical attributes.Attack: this column describes the attack points of a monster.Defense: this column describes the defense points of a monster.HP: this column describes the health points of a monster.Sp. ATK: this column describes the special attack points of a monster.Sp. DEF: this column describes the special defense points of a monster.Speed: this column describes the speed points of a monster.Generation: this column describes the generation category, it is ranked from 1 to 6.Legendary: this column describes whether the monster has a legendary class or not, it is represented by boolean a value (True or False).
Now, after we read the dataset, we need to move on the next steps of learning groupby operations. But before that we need to write a few lines of code.
del pokemon_data['Name']
The code above deleted the Name column, because we don't need a string information in our data. groupby operations need just categorical or numerical information.
Code steps: From Zero to Hero.
In the following sections, we will introduce our learning steps of groupby operations. each step will state a statistical question, and we will show the code that will provide the output to that question.
This is our final working dataset: 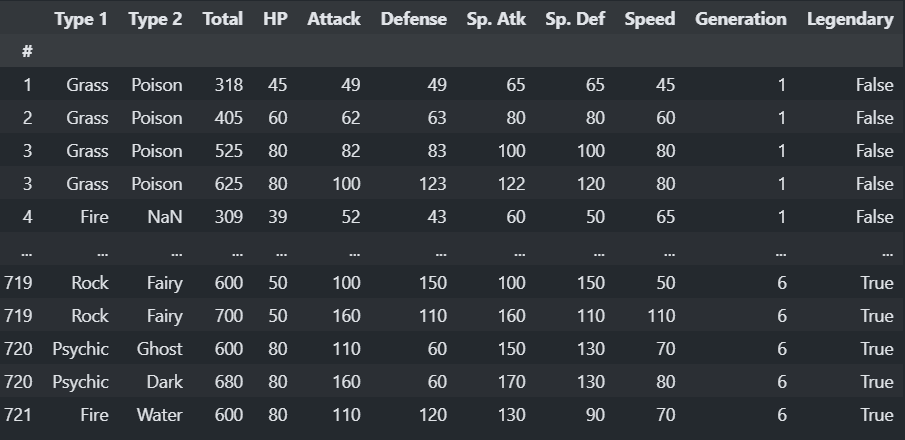
Step 1: Apply a groupby operation with a mean function
-
Question: What is the mean
Totalattribute for each pokemonGenerationattribute? -
Answer: First, you need to group the data into a
Generationgroup, and then apply the mean on theTotal. -
Code:
pokemon_data[['Total', 'Generation']].groupby('Generation').mean()
Output:
| Generation | Total      |
| ---------- | ---------- |
| 1          | 426.813253 |
| 2          | 418.283019 |
| 3          | 436.225000 |
| 4          | 459.016529 |
| 5          | 434.987879 |
| 6          | 436.378049 |
This can be done with the sum() function, the min() function, and many other statistical functions.
Try this block of code to try out different aggregate functions:
pokemon_data[['Total', 'Generation']].groupby('Generation').size() #aggregate by counting the values
pokemon_data[['Total', 'Generation']].groupby('Generation').min() #aggregate by minimum
pokemon_data[['Total', 'Generation']].groupby('Generation').max() #aggregate by maximum
pokemon_data[['Total', 'Generation']].groupby('Generation').std() #aggregate by standard deviation
pokemon_data[['Total', 'Generation']].groupby('Generation').sum() #aggregate by sum
pokemon_data[['Total', 'Generation']].groupby('Generation').prod() #aggregate by production
Step 2: Multiple aggregate functions in a single groupby
-
Question: Now, what is the mean and standard deviation of
Speedattribute for each generation? -
Answer: We can aggregate multiple functions in a single output using the
agg()function. -
Code: There are 2 versions of code that can result the same output, the second one is a simplified version :
Code 1:
pokemon_data.groupby("Generation").agg(
   average_speed = pd.NamedAgg("Speed","mean"), # here we apply the mean
   std_speed = pd.NamedAgg("Speed", "std"), # here we apply the standard deviation
)
Code 2:
pokemon_data.groupby("Generation").agg(
average_speed=("Speed","mean"), # applying the mean
std_speed = ("Speed", "std"), # applying the standard deviation
)
- Output:
| Generation | average_speed | std_speed |
| ---------- | ------------- | --------- |
| 1          | 72.584337     | 29.675857 |
| 2          | 61.811321     | 27.263132 |
| 3          | 66.925000     | 31.331972 |
| 4          | 71.338843     | 28.475005 |
| 5          | 68.078788     | 28.726632 |
| 6          | 66.439024     | 25.691954 |
Step 3: Group by multiple columns
-
Question: what is the maximum
Attackattribute for eachGenerationattribute? and we want to know whichLegendaryattribute has the maximumAttackfor eachGeneration. -
Answer: we can do that by goruping by
GenerationandLegendaryat the same time. -
Code :
pokemon_data.groupby(['Generation', 'Legendary']).agg(
maximum_attack = ('Attack', 'max')
)
- Output :
| Generation | Legendary | maximum_attack |
| ---------- | --------- | -------------- |
| 1          | True      | 155            |
|            | False     | 190            |
| 2          | True      | 185            |
|            | False     | 130            |
| 3          | True      | 165            |
|            | False     | 180            |
| 4          | True      | 170            |
|            | False     | 160            |
| 5          | True      | 147            |
|            | False     | 170            |
| 6          | True      | 150            |
|            | False     | 160            |
Step 4: Sorting group results (Multiple column case)
-
Question: What are the types (
Type 1to be specific) of pokemon that have the maximumAttackattributes for eachGenerationcolumn? the results need to be sorted, so that the maximum value for each Generation and type will be spotted easily. -
Answer: Code and output will explain.
-
Code:
pokemon_data.groupby(['Generation', 'Legendary']).agg(
maximum_attack = ('Attack', 'max')
).sort_values(by = 'maximum_attack', ascending = False)
- Output: The output is specified with
Generation1 attribute.
Generation Legendary
1          True                  190
2          False                 185
3          True                  180
4          False                 170
5          True                  170
3          False                 165
4          True                  160
6          True                  160
1          False                 155
6          False                 150
5          False                 147
2          True                  130
Step 5: Use groupby with filtering:
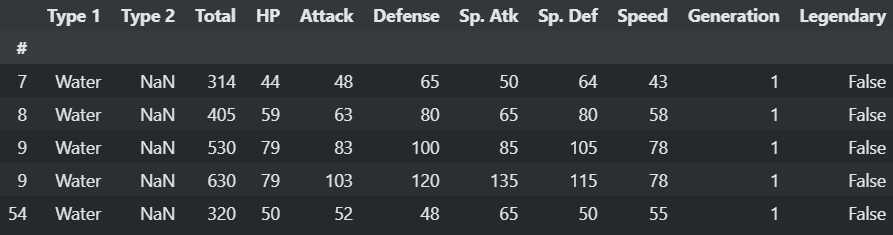
This step won't be in question/Answer format. We can filter our data by Type 1, for example:
pokemon_data[pokemon_data['Type 1'] == 'Water'].head()
# or
pokemon_data.loc[ pokemon_data['Type 1'] == 'Water' , ['Attack']]
Now we need to use a grouby operation with a filter:
grouped = pokemon_data.groupby('Type 1')
grouped.filter(lambda x: x['Attack'].mean() > 100)
This code displays only the Dragon type, because the mean attack of all dragon pokemons is above 100.
FREE VS Code / PyCharm Extensions I Use
✅ Write cleaner code with Sourcery, instant refactoring suggestions: Link*
Python Problem-Solving Bootcamp
🚀 Solve 42 programming puzzles over the course of 21 days: Link*